Checks on astrometry
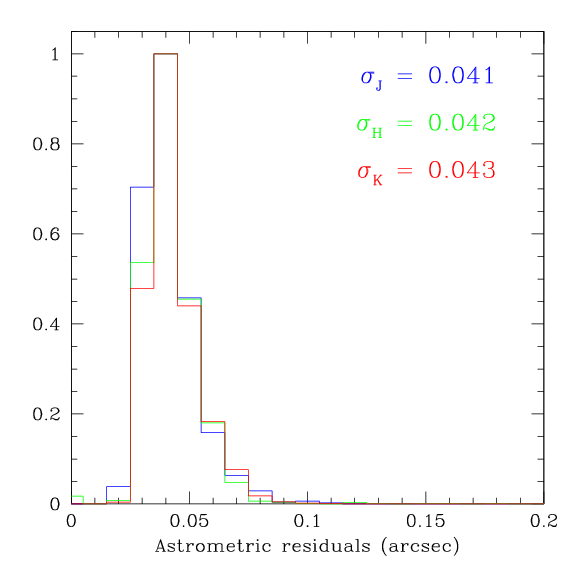
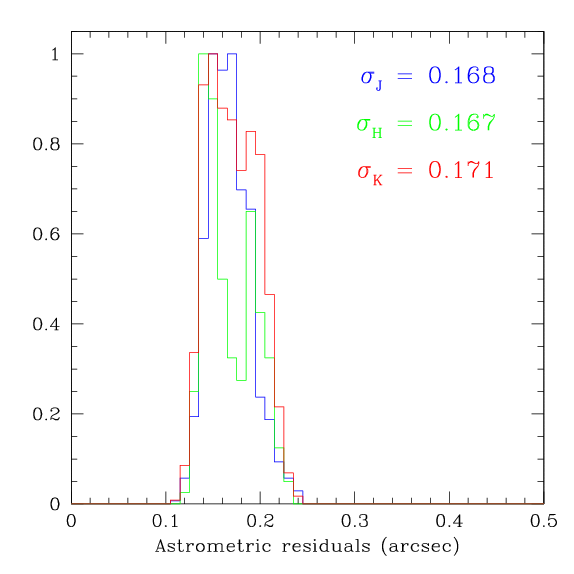
This page describes the series of checks that are done on the astrometric calibration in WIRwolf. For each image stack, the catalog is matched back to catalogs from each of the input image slices to check for catastrophic errors. The difference in positions are examined in multiple ways. Images with catastrophic errors are rejected. The validated images have typical astronometric errors of 0.04" (internal) and 0.17" (external).
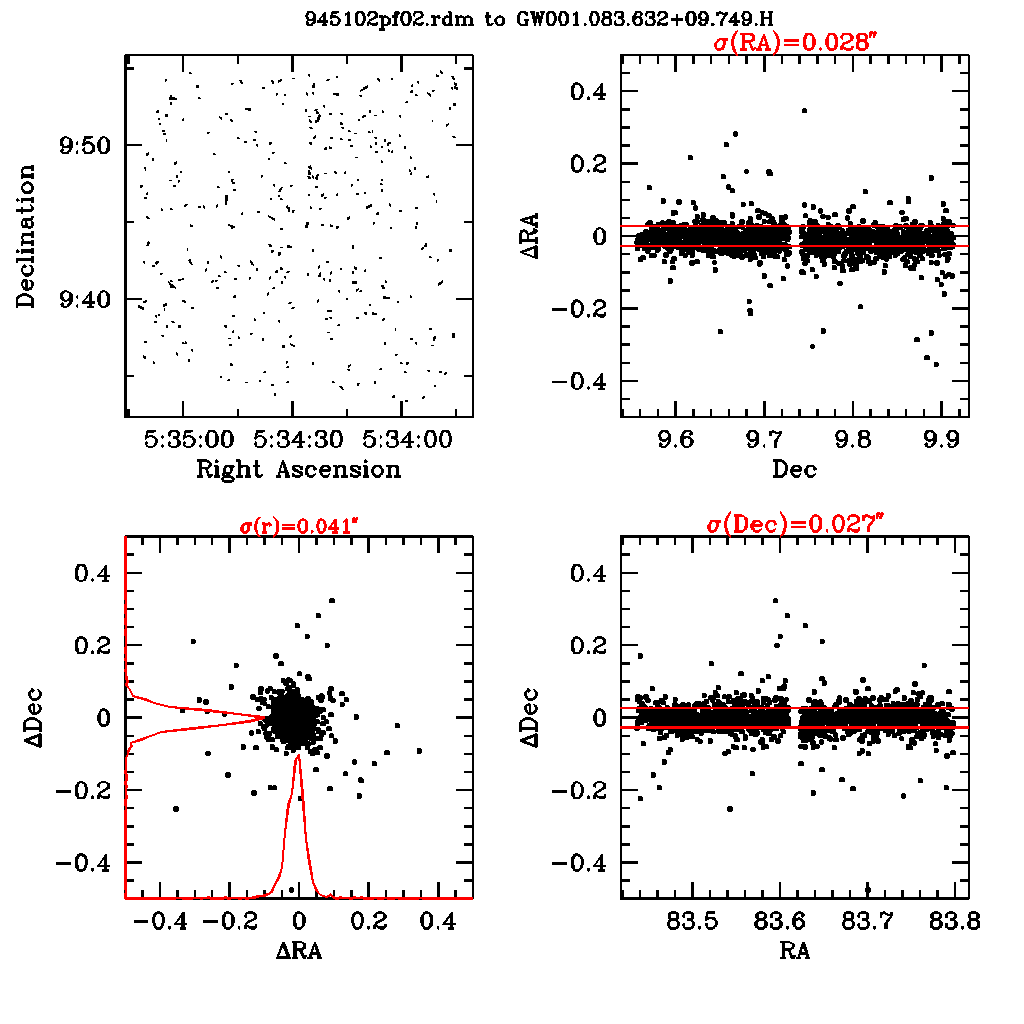
Here is a match between the catalog of the exposure 945102 (slice 2) and the final catalog (WIRwolf group: GW001.083.632+09.749, H filter) are compared. The plot below shows a whisker plot of the astrometric residuals in the top left panel. The difference in position in the two catalogs being compared is shown as a line (greatly exagerated in length). The bottom left panel shows a scatter plot of the residuals in RA and Dec. The two right panels show the residuals in RA and Dec as a function Dec and RA respectively. While the scatter varies in difference parts of the field, there is no conspicuous evidence for systematic shifts.
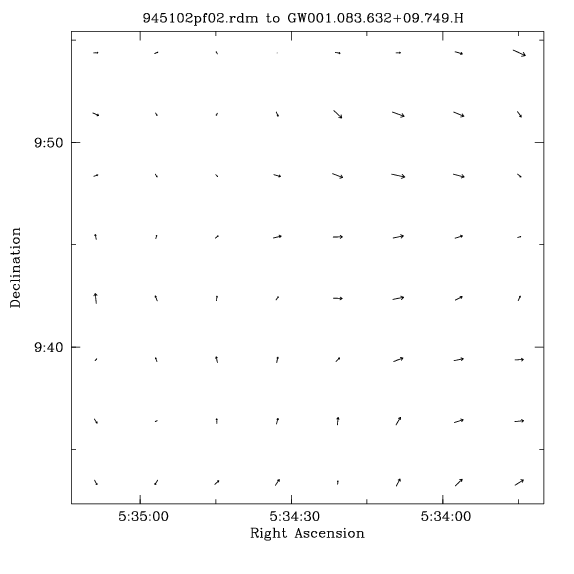
The plot below shows a whisker plot of the astrometric residuals. In this case however, the shifts are averaged over small regions, 0.05 degrees accross. It is now possible to measure small systematic shifts. The largest shift here is 0.01 arcseconds, or 3% of 0.3 arcsecond. While all systematic shifts undesirable, 0.01 is acceptable. Groups showing shifts larger than 0.06'' (i.e. a fifth of a WIRcam pixel) are rejected in any 0.05 degree patch are rejected.
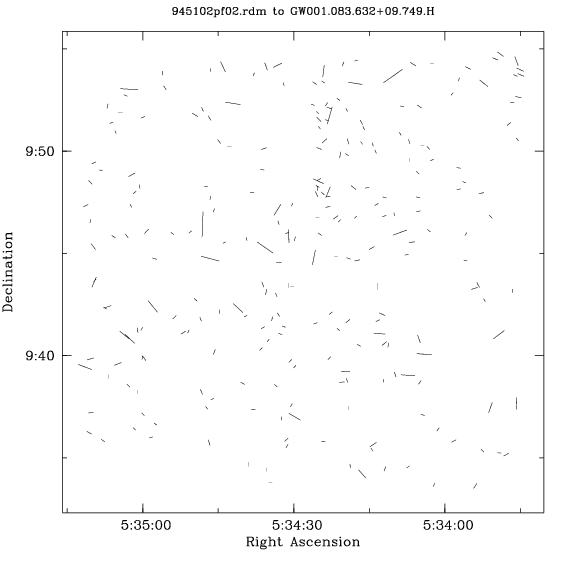
The plot below shows a whisker plot of the astrometric residuals, similiar to the top left panel of the plot above. The residuals have been exagerated to an even greater degree. The orientation of the vectors is essentially random in this case. To test this, the vectors are grouped. For each vector, the position angle of the all the neighbouring vectors with 1 arcminute on the sky are compared. If the neighbouring vectors are mostly parallel to the vector (ie, if 90% of their position angles are within 30 degrees to the vector in question), this suggests that systematic shift is occuring; the vector is flagged as bad. This can, of course, occur randomly. If 20 or more vectors in a field are found to have predomiately parallel neighbours, the group is rejected. If 5 or more vectors are bad, the group is subjected to further visual scrutiny. However, if an image has less than 20 bad vectors, visual inspection usually indicates no problems.
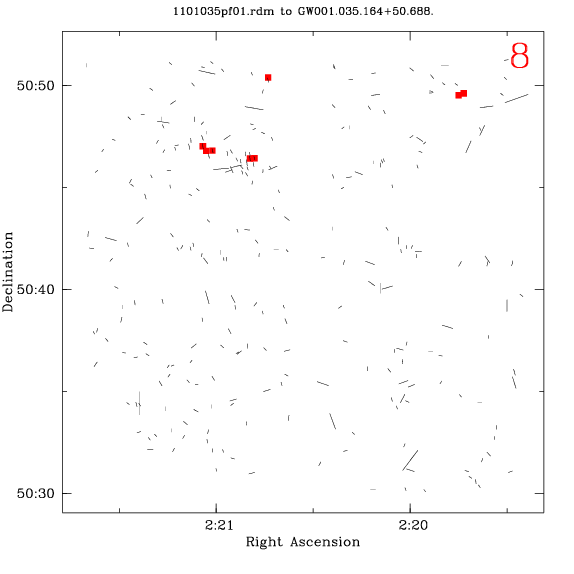
The plot below shows an example where the astrometry has failed. Several areas are visible were the vectors are parallel. They are highlighted with red dots.
The plots above are used to diagnose catastrophic errors in astrometry. More generally, the typically internal astrometric errors are found to be about 0.04''. This is shown in the histogram below.
Similarly, the astrometric residuals with respect to 2MASS are shown in the figure at right. They are typically about 0.17 arcseconds. Of course, most of the stars in these matches are at the faint limit of 2MASS, so these numbers are dominated by random errors. There is no evidence for systematic offsets between 2MASS and WIRwolf images.
- Date modified: